class: center, inverse background-image: url(img/dplyr_old_new.png) background-position: 50% 40% background-size: 70% # Column-wise operations with `dplyr`: # Old and New <br><br><br><br> ## Brendan Cullen ### [RStudio Certified Trainer](https://education.rstudio.com/trainers/people/cullen+brendan/) ### [<i class="fas fa-globe "></i>](https://bcullen.rbind.io/) [bcullen.rbind.io](https://bcullen.rbind.io/) | [<i class="fab fa-twitter "></i>](https://twitter.com/_bcullen) [_bcullen](https://twitter.com/_bcullen) | [<i class="fab fa-github "></i>](https://github.com/brendanhcullen) [brendanhcullen](https://github.com/brendanhcullen) ### Slides: [<i class="fas fa-link "></i>](https://columnwise-operations-dplyr.netlify.app/) [columnwise-operations-dplyr.netlify.app](https://columnwise-operations-dplyr.netlify.app/) <style type="text/css"> pre { max-width: 100%; overflow-x: scroll; } .inverse { background-color: #272822; color: #d6d6d6; text-shadow: 0 0 20px #333; } </style> --- # Concept map 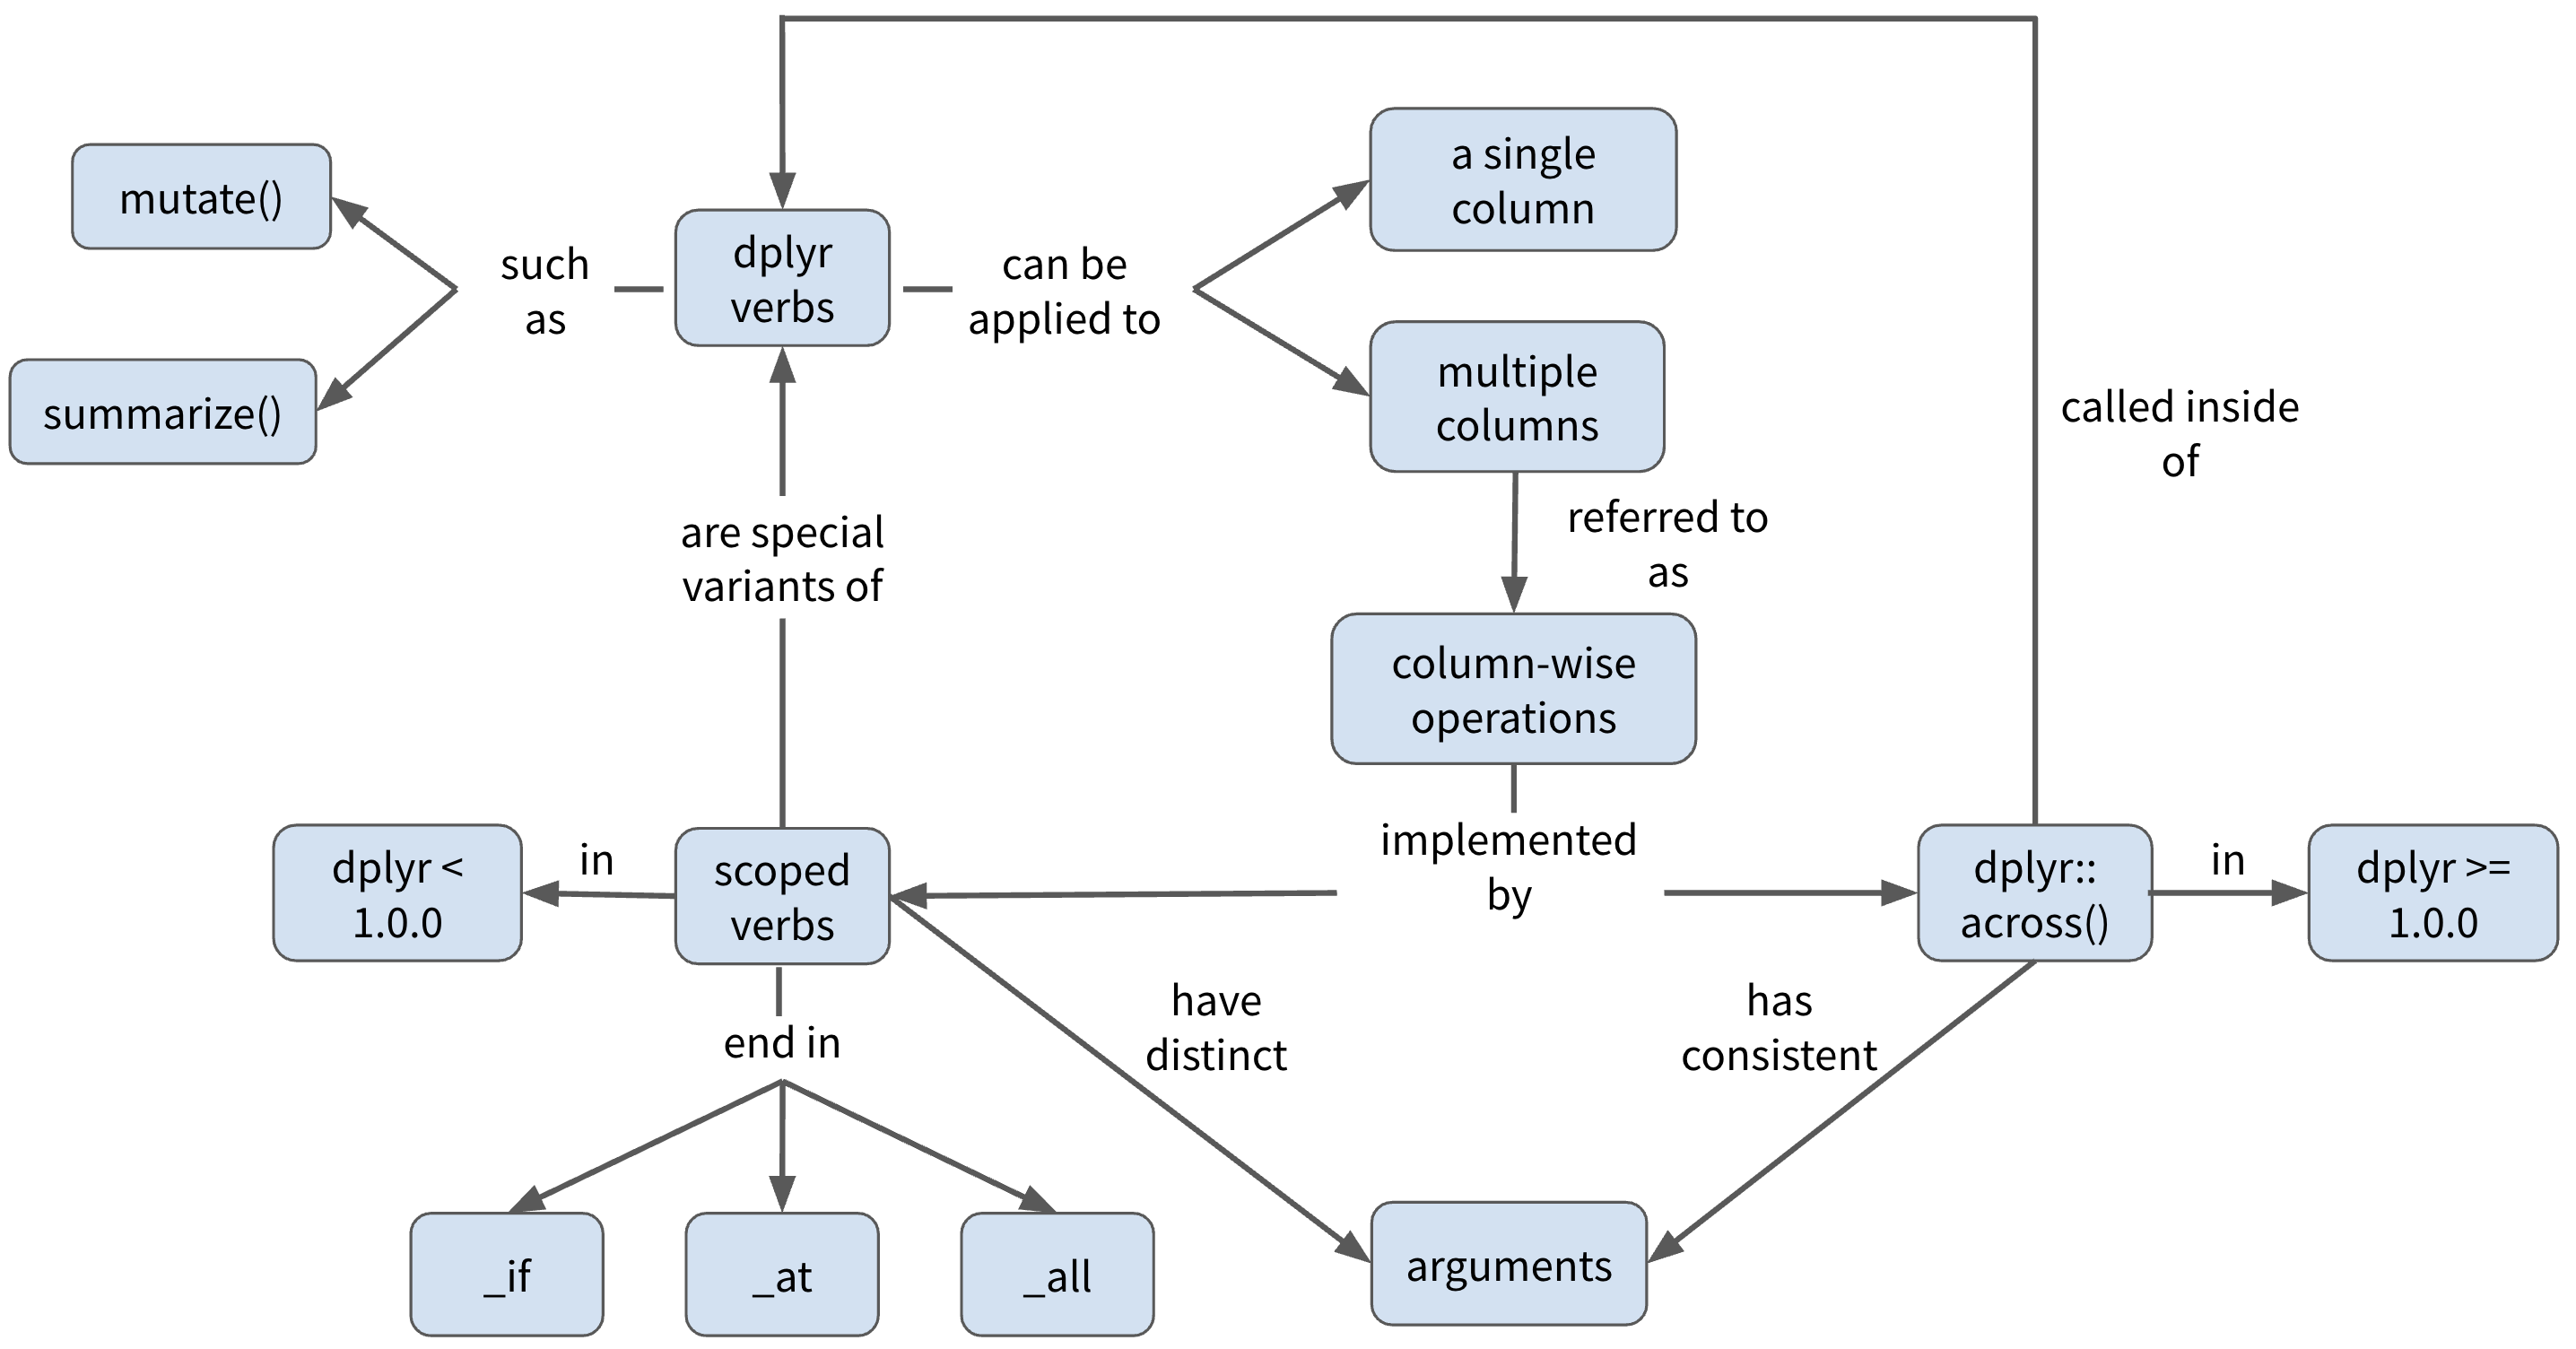 --- class: inverse # Learning objectives -- - ***Review*** how to apply `dplyr` functions, e.g. `mutate()`, `summarize()`, to single columns <br> -- - ***Learn*** how to perform column-wise operations two ways: - scoped verbs, e.g. `summarize_at()`, `summarize_if()`, etc... - `across()` from `dplyr` 1.0.0 -- <br> - ***Apply*** `across()` to summarize multiple columns of data <br> --- background-image: url(img/dplyr_hex_old.png) background-position: 90% 5% background-size: 10% # Column-wise operations **Column-wise operations** refers to applying the same `dplyr` verbs (or other data transformation functions) to multiple columns simultaneously. -- e.g. Create multiple new columns with `mutate()` <img src="img/mutate.png" width="40%" /> -- e.g. Summarize multiple columns with `summarize()` <img src="img/summarize_multiple.png" width="40%" /> --- background-image: url(img/penguins_hex.png) background-position: 90% 5% background-size: 10% # Palmer Penguins ```r library(palmerpenguins) library(tidyverse) ``` ```r glimpse(penguins) ``` ``` ## Rows: 344 ## Columns: 8 ## $ species <fct> Adelie, Adelie, Adelie, Adelie, Adelie, Adelie, Adelie, Adelie, Adelie, Adelie, Adeli… ## $ island <fct> Torgersen, Torgersen, Torgersen, Torgersen, Torgersen, Torgersen, Torgersen, Torgerse… ## $ bill_length_mm <dbl> 39.1, 39.5, 40.3, NA, 36.7, 39.3, 38.9, 39.2, 34.1, 42.0, 37.8, 37.8, 41.1, 38.6, 34.… ## $ bill_depth_mm <dbl> 18.7, 17.4, 18.0, NA, 19.3, 20.6, 17.8, 19.6, 18.1, 20.2, 17.1, 17.3, 17.6, 21.2, 21.… ## $ flipper_length_mm <int> 181, 186, 195, NA, 193, 190, 181, 195, 193, 190, 186, 180, 182, 191, 198, 185, 195, 1… ## $ body_mass_g <int> 3750, 3800, 3250, NA, 3450, 3650, 3625, 4675, 3475, 4250, 3300, 3700, 3200, 3800, 440… ## $ sex <fct> male, female, female, NA, female, male, female, male, NA, NA, NA, NA, female, male, m… ## $ year <int> 2007, 2007, 2007, 2007, 2007, 2007, 2007, 2007, 2007, 2007, 2007, 2007, 2007, 2007, 2… ``` --- background-image: url(img/dplyr_hex_old.png) background-position: 90% 5% background-size: 10% # Column-wise operations ***Let's review...*** Apply `summarize()` to a **single** column. <img src="img/summarize_single.png" width="20%" /> -- .panelset[ .panel[.panel-name[Example] .pull-left[ 🤔 Use `summarize()` to calculate the mean **bill length** for each species in `penguins` ❓ What function do you need to include before `summarize()` in order to calculate means for each species? ] .pull-right[ <img src="img/penguins.png" width="75%" /> Artwork by @allison_horst ] ] .panel[.panel-name[Code] ```r penguins %>% group_by(species) %>% summarize(bill_length_mm = mean(bill_length_mm, na.rm = TRUE)) ``` ] .panel[.panel-name[Output] ``` ## # A tibble: 3 x 2 ## species bill_length_mm ## <fct> <dbl> ## 1 Adelie 38.8 ## 2 Chinstrap 48.8 ## 3 Gentoo 47.5 ``` ] ] --- name: multiple columns background-image: url(img/dplyr_hex_old.png) background-position: 90% 5% background-size: 10% # Column-wise operations Apply `summarize()` to **multiple columns** at once <img src="img/summarize_multiple.png" width="20%" /> -- .panelset[ .panel[.panel-name[Example #1] .pull-left[ 🤔 Calculate the mean **bill length** and **bill depth** for each species 🚫 Avoid copying and pasting or repeating `mean()` more than once in your solution ] .pull-right[ <img src="img/culmen_depth.png" width="100%" /> ] .pull-right[Artwork by @allison_horst] ] .panel[.panel-name[Code] <code class ='r hljs remark-code'>penguins %>% <br> group_by(species) %>% <br> <span style='background-color:#ffff7f'>summarize_at</span>(vars(c(bill_length_mm, bill_depth_mm)), <br> mean, na.rm = TRUE)</code> 🔍 `summarize_at()` is an example of a **scoped verb**. It is a special variant of `summarize()` that applies a summary function to a specific set of columns. ⚠️ When using scoped verbs ending in `_at()` you must use `vars()` to select columns. ❓ How many columns will be in our output? ] .panel[.panel-name[Output] ``` ## # A tibble: 3 x 3 ## species bill_length_mm bill_depth_mm ## <fct> <dbl> <dbl> ## 1 Adelie 38.8 18.3 ## 2 Chinstrap 48.8 18.4 ## 3 Gentoo 47.5 15.0 ``` ] ] --- template: multiple columns .panelset[ .panel[.panel-name[Example #2] 🤔 Calculate the mean of **all numeric** variables for each species. 🚫 Again, no copying and pasting or repeating `mean()` more than once! ] .panel[.panel-name[Code] <code class ='r hljs remark-code'>penguins %>% <br> group_by(species) %>% <br> <span style='background-color:#ffff7f'>summarize_if</span>(is.numeric, mean, na.rm = TRUE)</code> 🔍 `summarize_if()` is another example of a **scoped verb**. It is a special variant of `summarize()` that applies a summary function to a set of columns that all satisfy some logical criteria. 🔍 That logical criteria is specified using a **predicate function**, e.g. `is.numeric()`, which will return `TRUE` or `FALSE`. ] .panel[.panel-name[Output] ``` ## # A tibble: 3 x 6 ## species bill_length_mm bill_depth_mm flipper_length_mm body_mass_g year ## <fct> <dbl> <dbl> <dbl> <dbl> <dbl> ## 1 Adelie 38.8 18.3 190. 3701. 2008. ## 2 Chinstrap 48.8 18.4 196. 3733. 2008. ## 3 Gentoo 47.5 15.0 217. 5076. 2008. ``` ] ] --- class:inverse, center, middle # Your Turn #1 ### Click [here](https://brendancullen.shinyapps.io/columnwise_operations_formative_assessment/#section-your-turn-1). --- name: better way # A better way? .pull-left[ .center[ ## `dplyr` < 1.0.0 <img src="img/dplyr_hex_old.png" width="50%" /> `summarize_at()`, `summarize_if()`, `summarize_all()`, `mutate_if()`, `mutate_at()`, `mutate_all()`, ... ##😓 ] ] -- .pull-right[ .center[ ## `dplyr` >= 1.0.0 <img src="img/dplyr_hex_new.png" width="50%" /> `across()` <br><br><br> ##😎 ] ] --- background-image: url(img/dplyr_hex_new.png) background-position: 90% 5% background-size: 10% # `dplyr::across()`  .pull-right[Artwork by @allison_horst] --- background-image: url(img/dplyr_hex_new.png) background-position: 90% 5% background-size: 10% # `dplyr::across()` 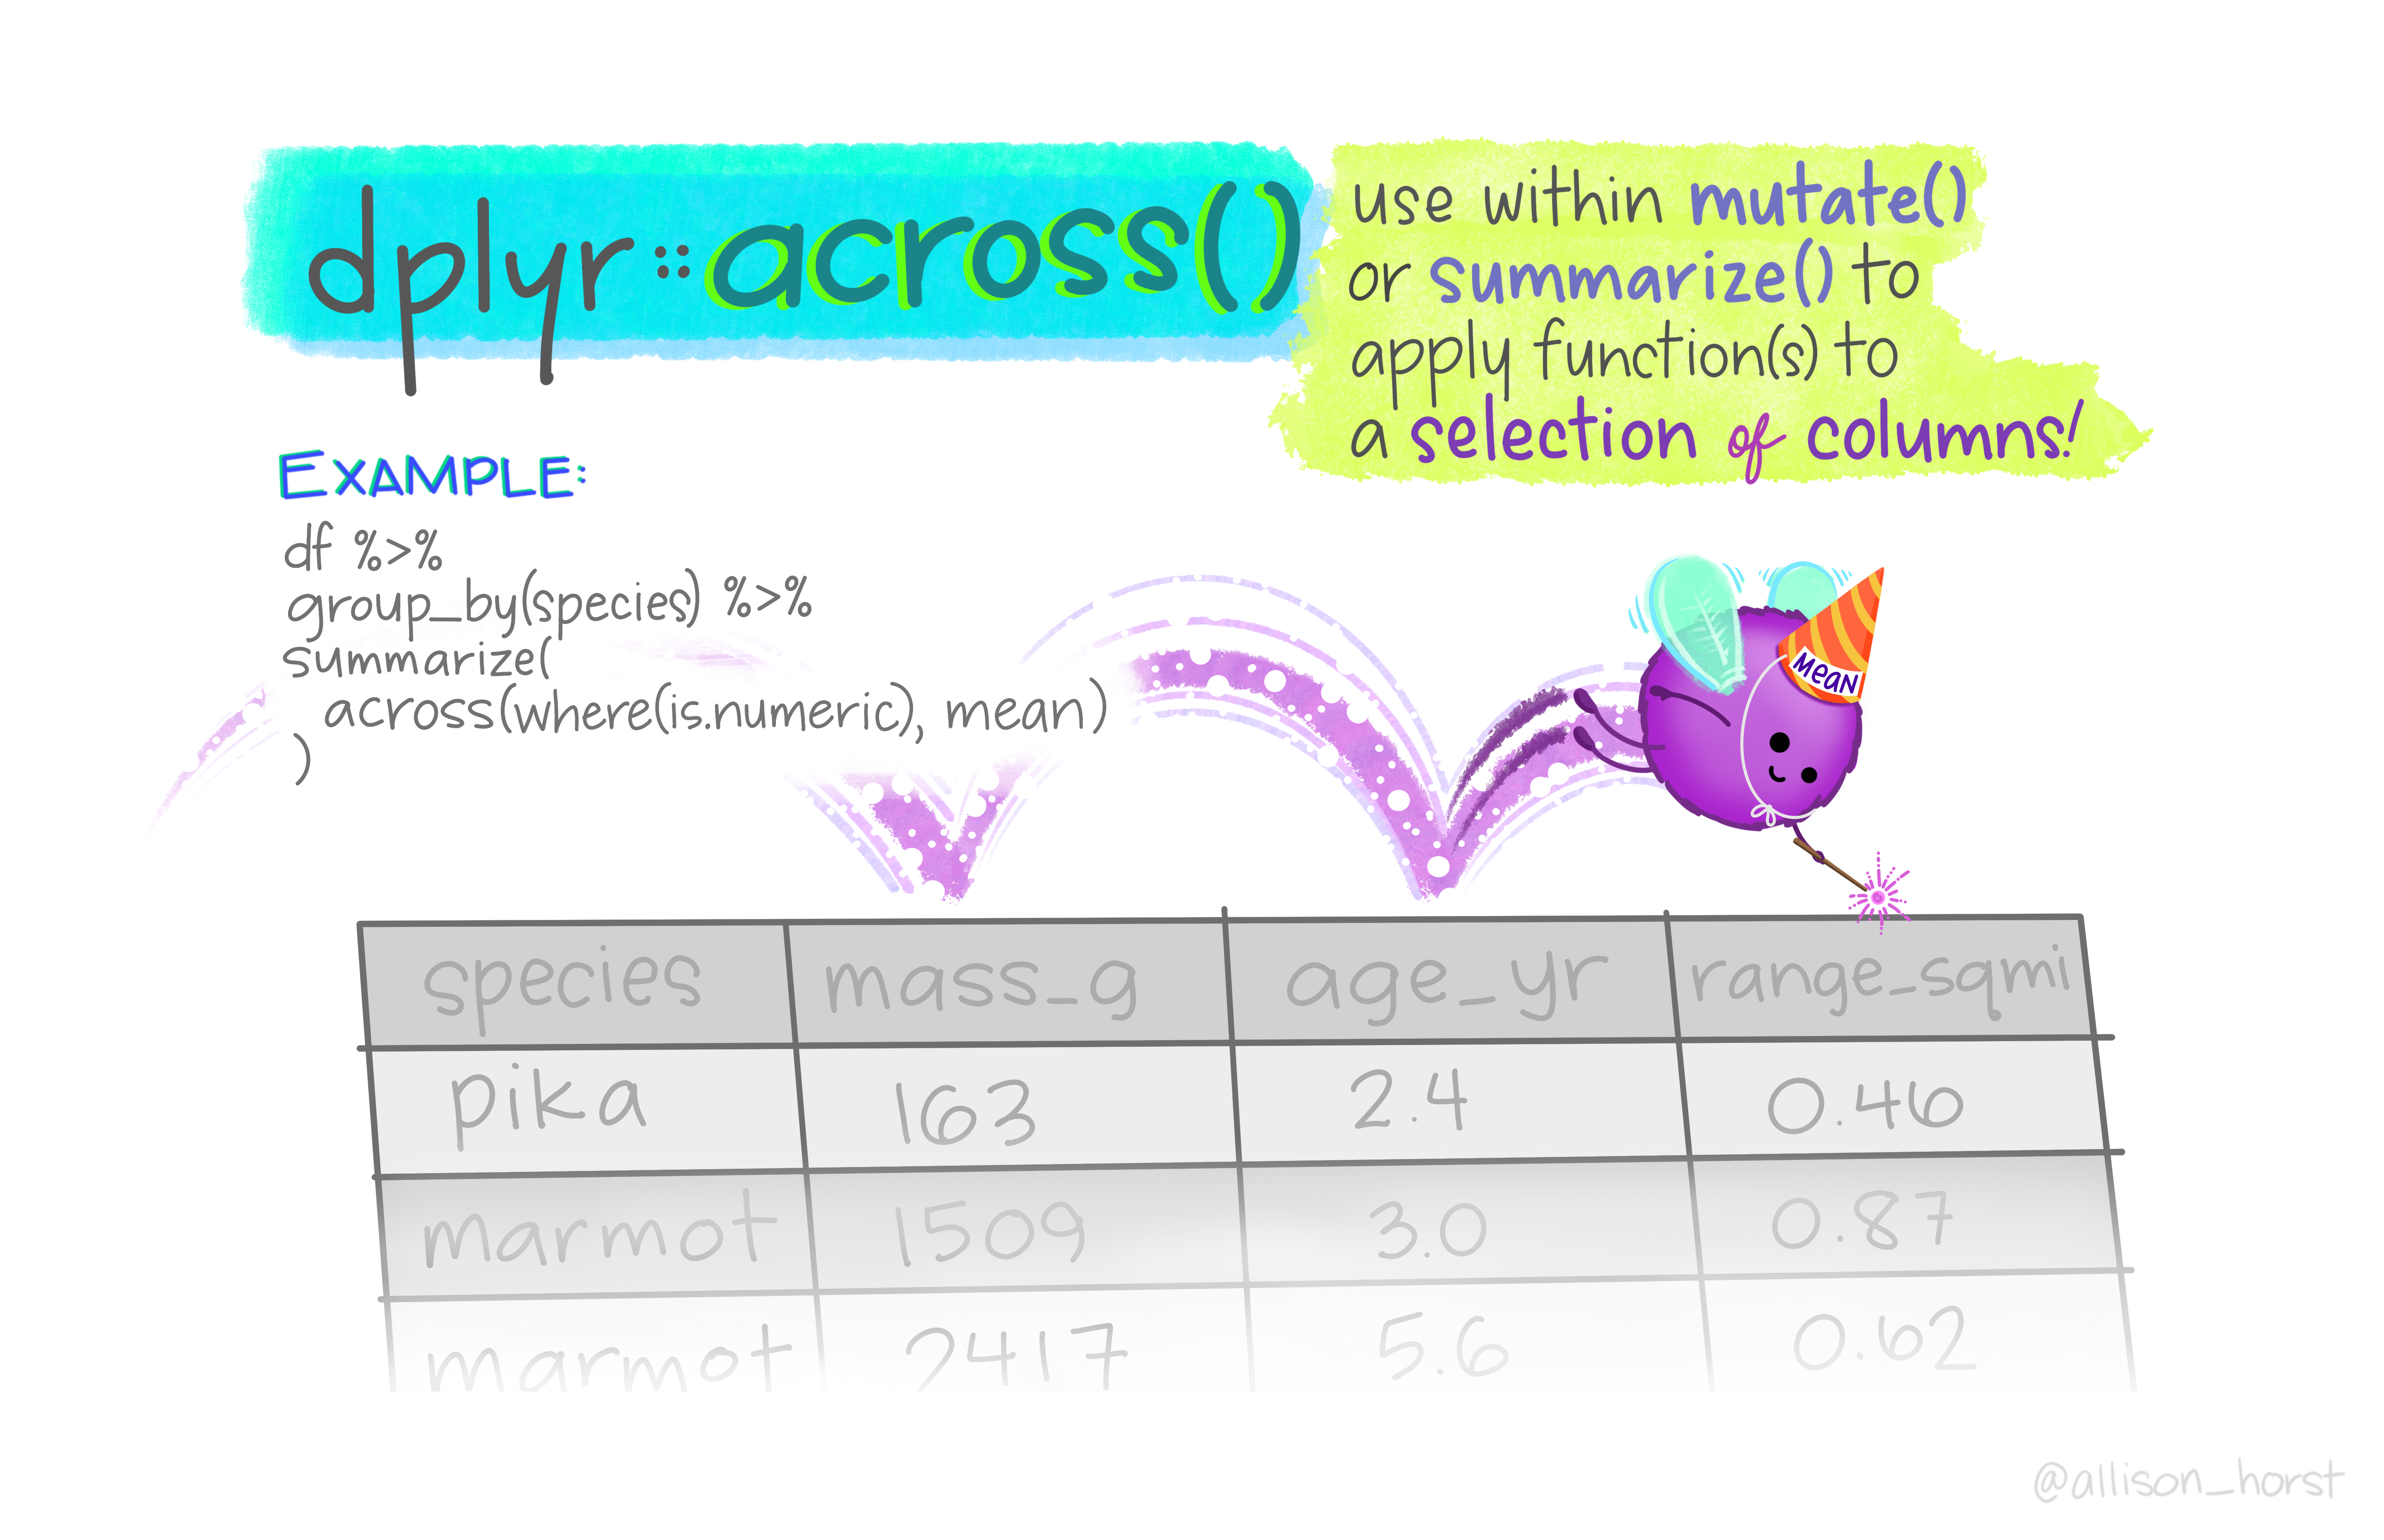 .pull-right[Artwork by @allison_horst] --- # `dplyr::across()` <img src="img/dplyr_across_concept_map.png" width="85%" /> .footnote[Source: [rstudio/concept-maps](https://github.com/rstudio/concept-maps/#across), courtesy of [Emma Vestesson](https://emmavestesson.netlify.app/)] --- background-image: url(img/dplyr_hex_new.png) background-position: 90% 5% background-size: 10% # `dplyr::across()` <code class ='r hljs remark-code'>across(<span style='color:cornflowerblue'>.cols</span>, <span style='color:red'>.fns</span>, <span style='color:orange'>...</span>, <span style='color:darkorchid'>.names</span>)</code> -- <span style="color: cornflowerblue"> `.cols` </span> = the columns you want to transform <br> -- <span style="color: red">`.fns` </span> = the function(s) you want to apply to each of the selected columns <br> -- <span style="color: orange"> `...` </span> = additional arguments for the function(s) specified in `.fns` (e.g. `na.rm = TRUE`) <br> -- <span style="color: darkorchid"> `.names` </span> = how you want to name the output columns. Here, `"{col}"` is a special placeholder for the input column name, and you can add any suffix you want to it -- - e.g. When calculating the mean of the `year` column, specifying <span style="color: darkorchid"> `.names = "{col}_mean"` </span> would result in an output column named `"year_mean"` <br> --- background-image: url(img/dplyr_hex_new.png) background-position: 90% 5% background-size: 10% # `dplyr::across()` <code class ='r hljs remark-code'>across(<span style='color:cornflowerblue'>.cols</span>, <span style='color:red'>.fns</span>, <span style='color:orange'>...</span>, <span style='color:darkorchid'>.names</span>)</code> .panelset[ .panel[.panel-name[Example] 🤔 Use `across()` to calculate the mean of **all numeric** columns for each species in `penguins` 📣 Remember, `across()` goes *inside* of the `dplyr` function that you want to apply to multiple columns. ] .panel[.panel-name[Code 1.0] <code class ='r hljs remark-code'>penguins %>% <br> group_by(species) %>% <br> summarize(<span style='background-color:#ffff7f'>across</span>(<span style='color:cornflowerblue'>where(is.numeric)</span>, <br> <span style='color:red'>mean</span>, <br> <span style='color:orange'>na.rm = TRUE</span>, <br> <span style='color:darkorchid'>.names = '{col}_mean'</span>))</code> *** 🔍 <span style="color: cornflowerblue"> `where()` </span> is an example of a `tidyselect` helper function, like `starts_with()` or `contains()`. It selects the variables for which some **predicate function** , such as <span style="color: cornflowerblue"> `is.numeric()` </span>, returns `TRUE`. ] .panel[.panel-name[Output 1.0] ``` ## # A tibble: 3 x 6 ## species bill_length_mm_mean bill_depth_mm_mean flipper_length_mm_mean body_mass_g_mean year_mean ## <fct> <dbl> <dbl> <dbl> <dbl> <dbl> ## 1 Adelie 38.8 18.3 190. 3701. 2008. ## 2 Chinstrap 48.8 18.4 196. 3733. 2008. ## 3 Gentoo 47.5 15.0 217. 5076. 2008. ``` 👀 Notice that all of the output variables have the suffix `"_mean"`. ] .panel[.panel-name[Code 2.0] <code class ='r hljs remark-code'>penguins %>% <br> group_by(species) %>% <br> summarize(across(<span style='color:cornflowerblue'>where(is.numeric)</span>, <br> <span style='background-color:#ffff7f'><span style='color:red'>list(mean = mean)</span></span>, <br> <span style='color:orange'>na.rm = TRUE</span>))</code> *** 🔍 If you specify <span style="color: red"> `.funs` </span> as a named list, e.g. `list(mean = mean)`, then `across()` will automatically append the name of the applied function(s) to the names of the output columns. This way you don't have to manually specify a <span style="color: darkorchid"> `.names` </span> argument at all! ] .panel[.panel-name[Output 2.0] ``` ## # A tibble: 3 x 6 ## species bill_length_mm_mean bill_depth_mm_mean flipper_length_mm_mean body_mass_g_mean year_mean ## <fct> <dbl> <dbl> <dbl> <dbl> <dbl> ## 1 Adelie 38.8 18.3 190. 3701. 2008. ## 2 Chinstrap 48.8 18.4 196. 3733. 2008. ## 3 Gentoo 47.5 15.0 217. 5076. 2008. ``` 👀 Same exact output as before! ] ] --- class:inverse, center, middle # Your Turn #2 ### Click [here](https://brendancullen.shinyapps.io/columnwise_operations_formative_assessment/#section-your-turn-2). --- # Concept map  --- class:inverse # More resources - [Blog post](https://www.tidyverse.org/blog/2020/04/dplyr-1-0-0-colwise/) by Hadley Wickham highlighting `across()` as a key component of the `dplyr` 1.0.0 update. <br> - [This vignette](https://dplyr.tidyverse.org/articles/colwise.html) on tidyverse.org about column-wise operations. <br> - Two blog posts by Rebecca Barter on [scoped verbs](http://www.rebeccabarter.com/blog/2019-01-23_scoped-verbs/) and [`across()`](http://www.rebeccabarter.com/blog/2020-07-09-across/). <br> - [Interactive tutorial](https://tladeras.shinyapps.io/learning_tidyselect/) by Ted Laderas on `tidyselect` and a [full list](https://dplyr.tidyverse.org/reference/select.html) of selection helpers. <br>